Overview tab
The Overview tab is the default view when you open Analytics. It provides a summary of all signature activity across your workspace. At the top, four metric cards show your aggregate numbers: total views, total reach (unique users), total clicks, and average CTR. See Analytics Overview for what each metric means. Below the metrics, a timeline chart plots signature activity over your selected date range. Use the Day, Week, or Month toggles to change the chart grouping. Hover over any data point to see the exact value for that period. Use the date range picker in the top right corner to adjust the time window.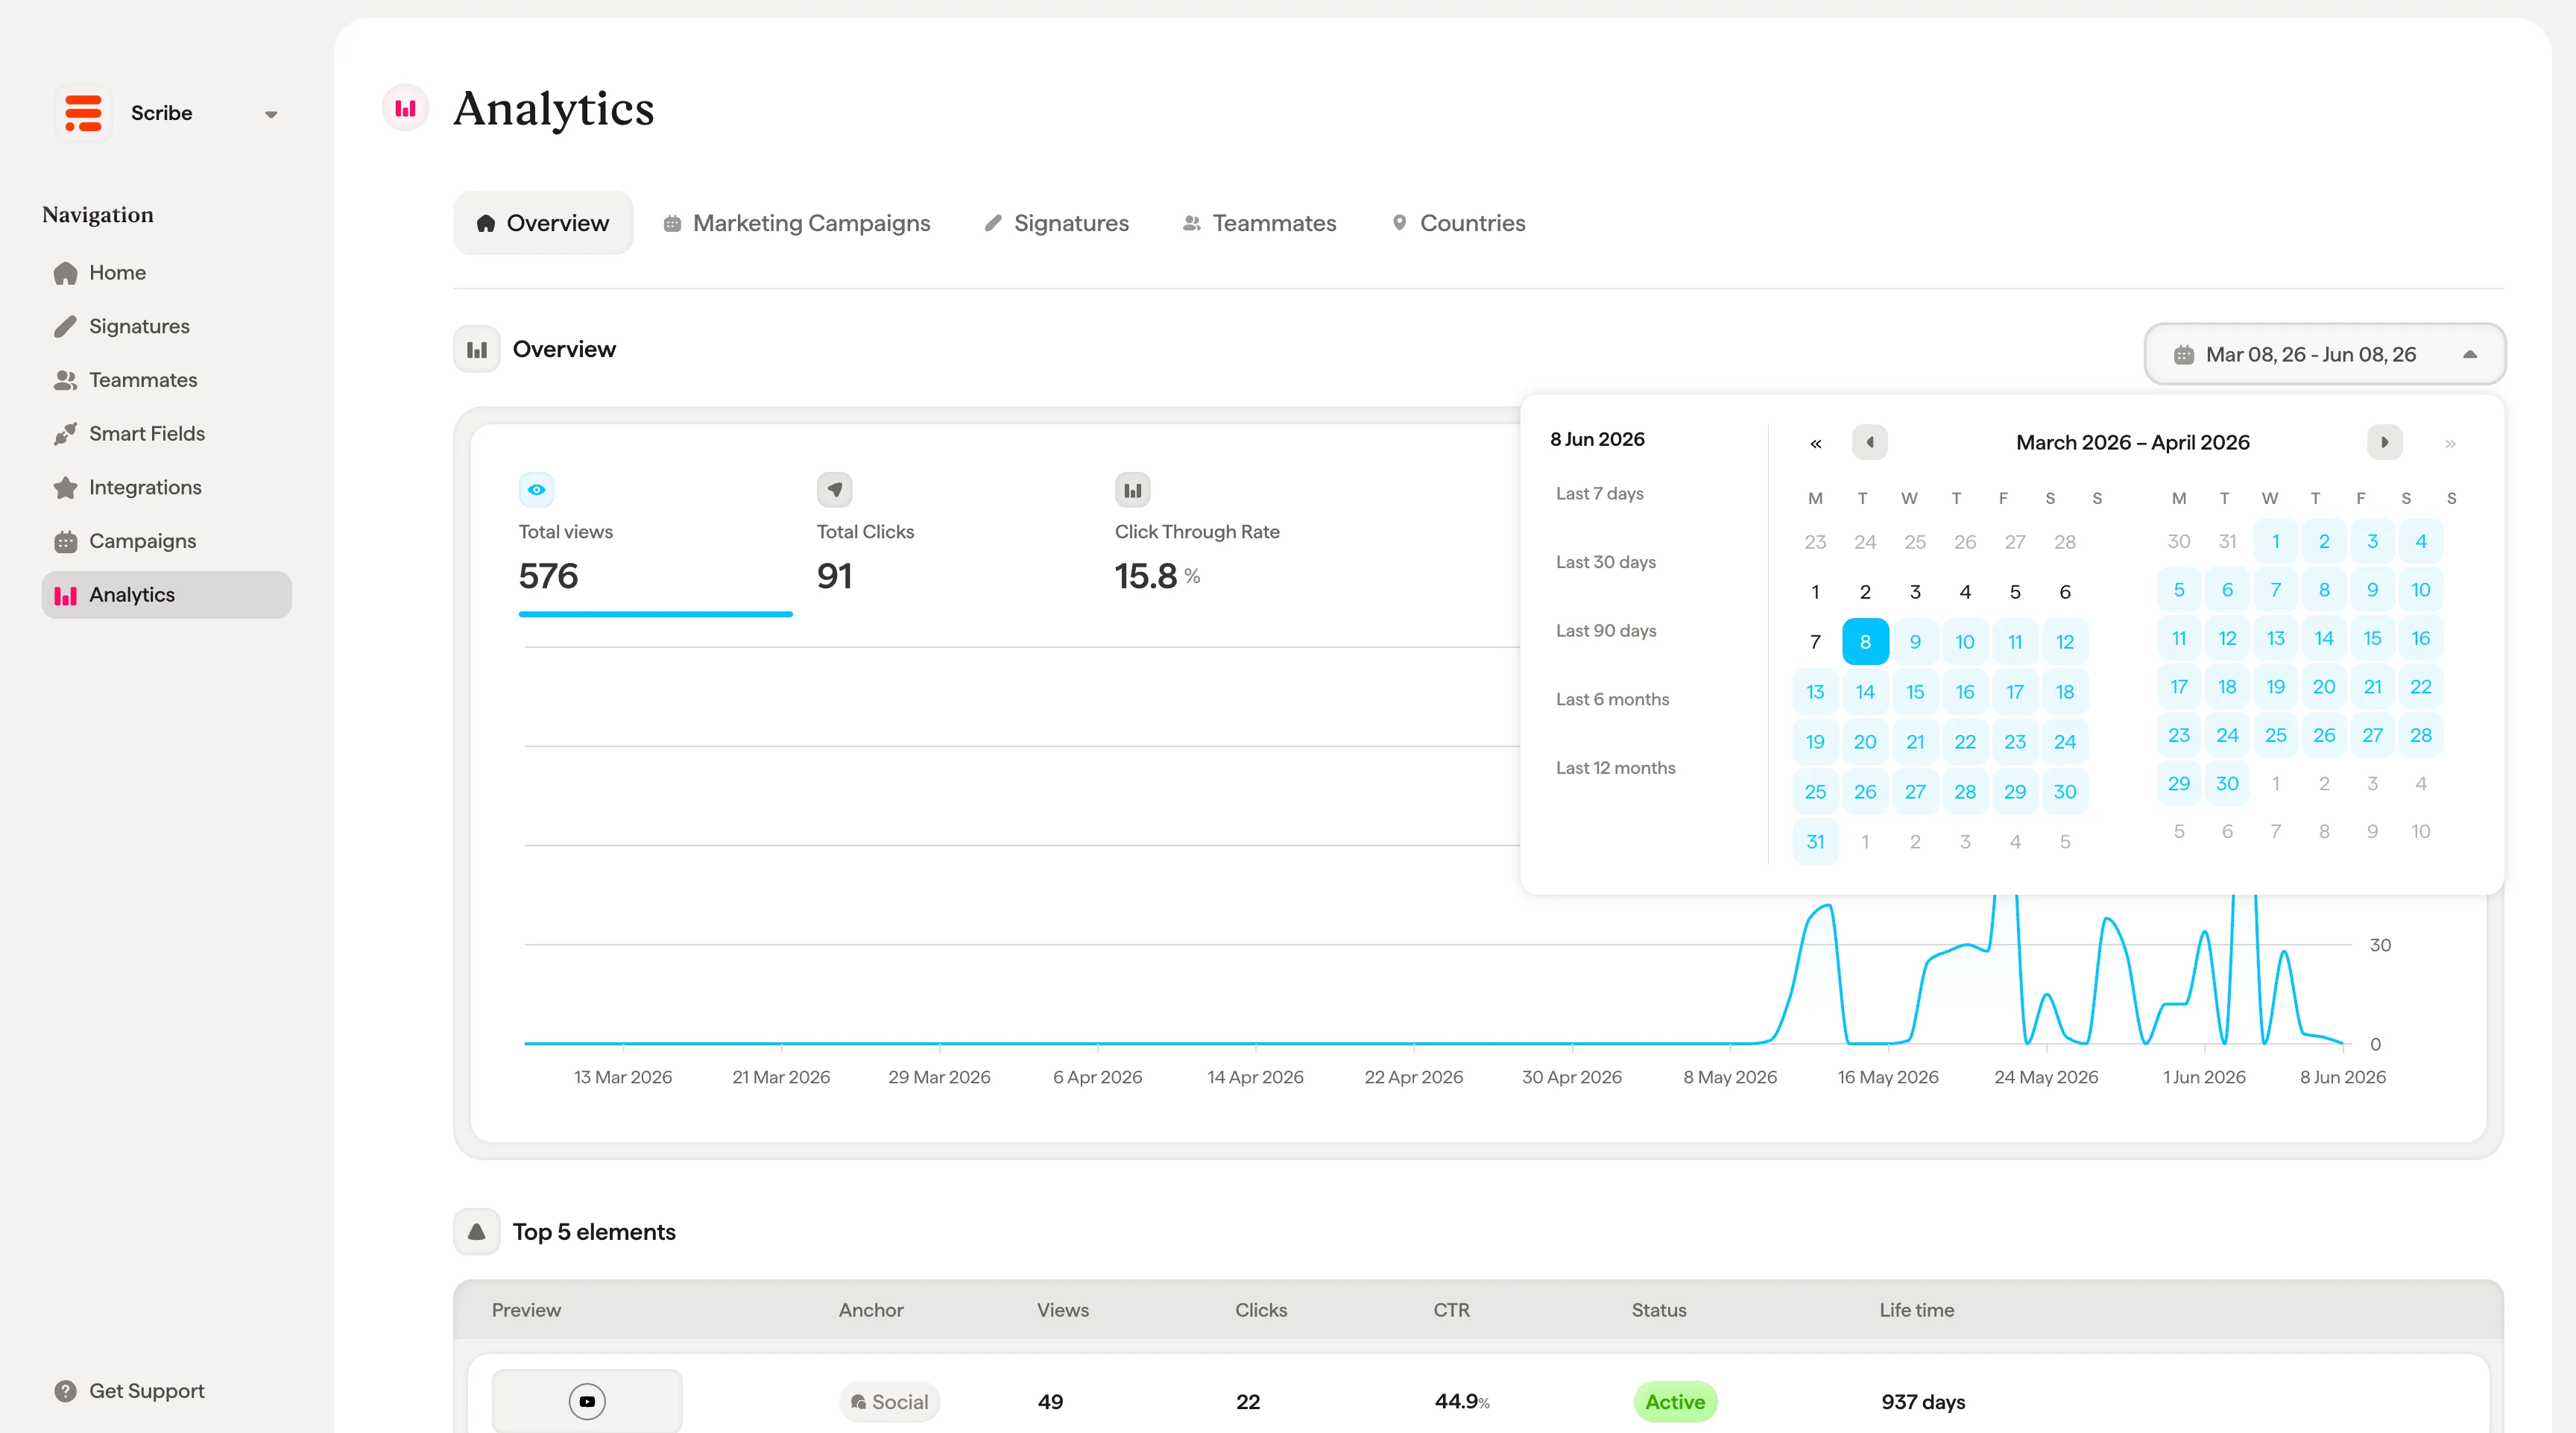
Marketing Campaigns tab
The Marketing Campaigns tab lists all your campaigns with their performance data. Each row shows:Signatures tab
The Signatures tab shows aggregated performance for each signature template. Each row displays:Signature detail page
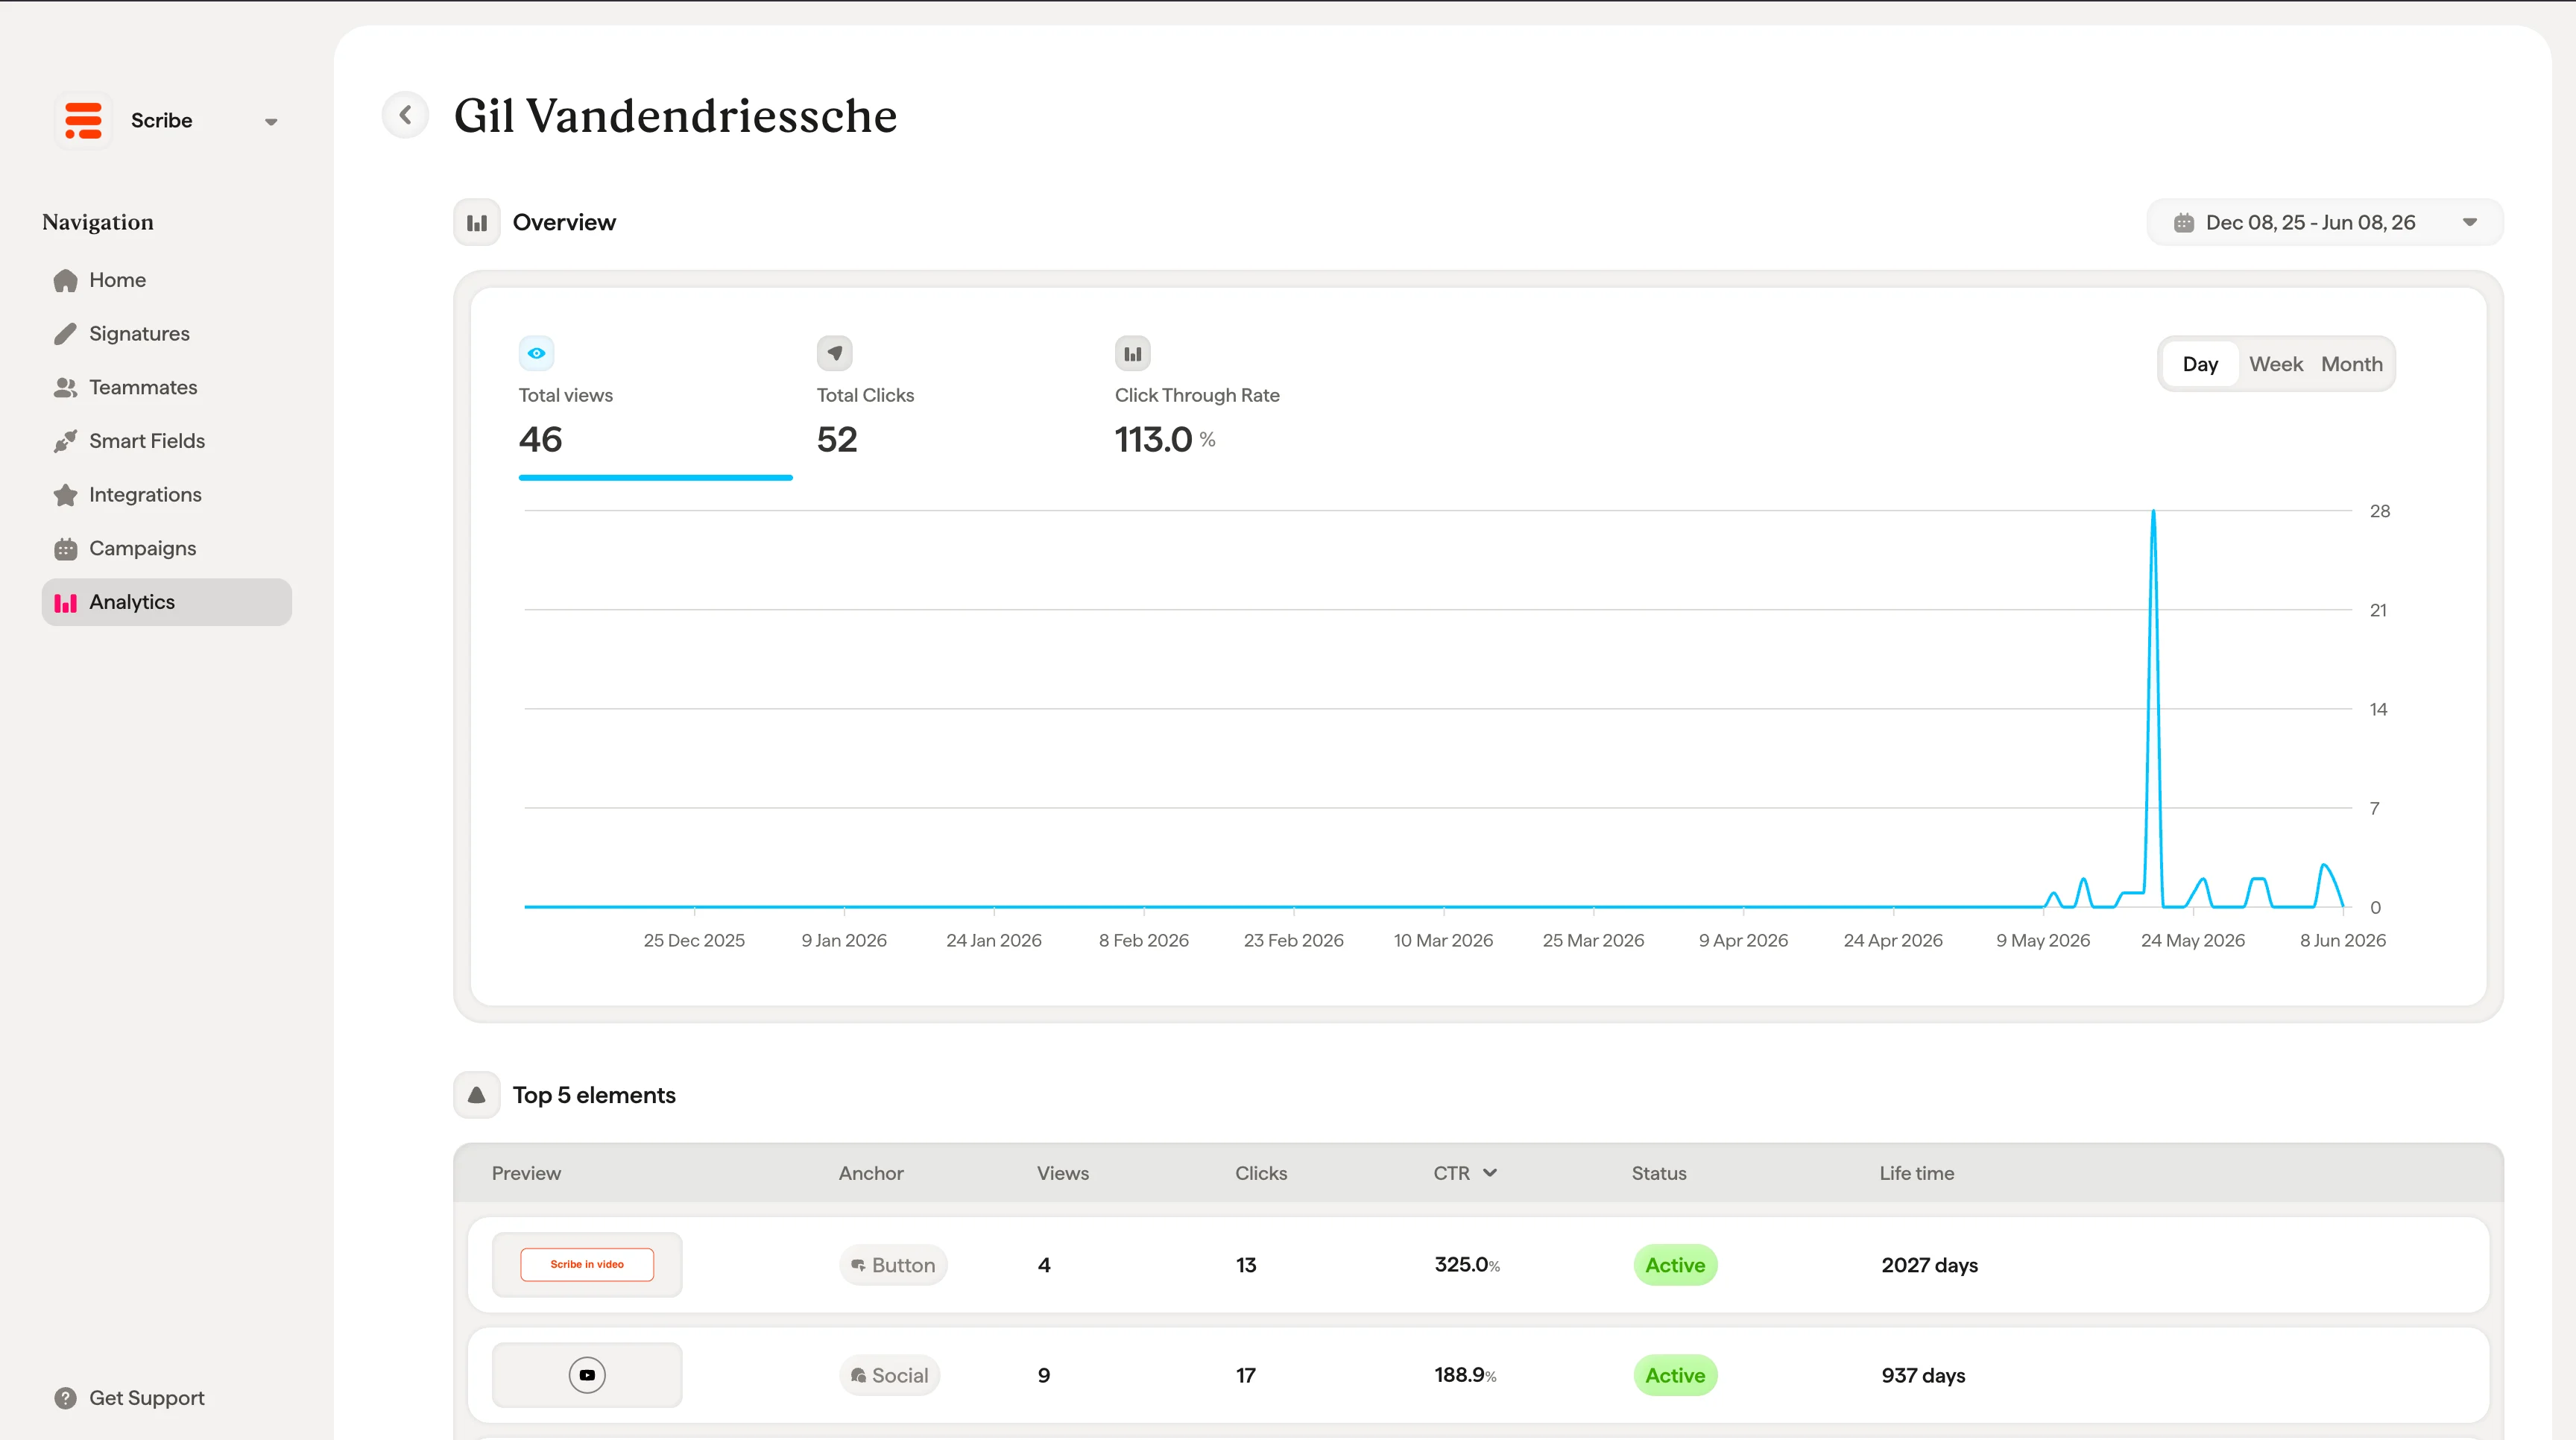
Click the arrow on any signature row to open its detail page. This page shows:- Signature preview. A live rendering of the signature on the left side.
- Conversion Rate. The same four metric cards (total views, total reach, total clicks, average CTR) scoped to this specific signature.
- Timeline chart. A chart plotting activity over time for this signature, with Day/Week/Month toggles.
- Top 5 elements. A table of the best-performing elements within this signature, showing preview, element type, link, views, clicks, CTR, status, and lifetime.
Teammates tab
The Teammates tab shows individual performance for each teammate. A search bar and Filter button at the top let you find specific teammates quickly. Each row shows:Teammate detail page
Click on a teammate to open their individual detail page. This page shows:- Overview metrics. Total views, total reach (unique users), total clicks, and average CTR for this teammate.
- Timeline chart. Activity over time with Day/Week/Month toggles and a date range picker.
- Top 5 elements. A table of the best-performing elements in this teammate’s signature, showing preview, element type, link, signature, views, clicks, CTR, status, and lifetime.
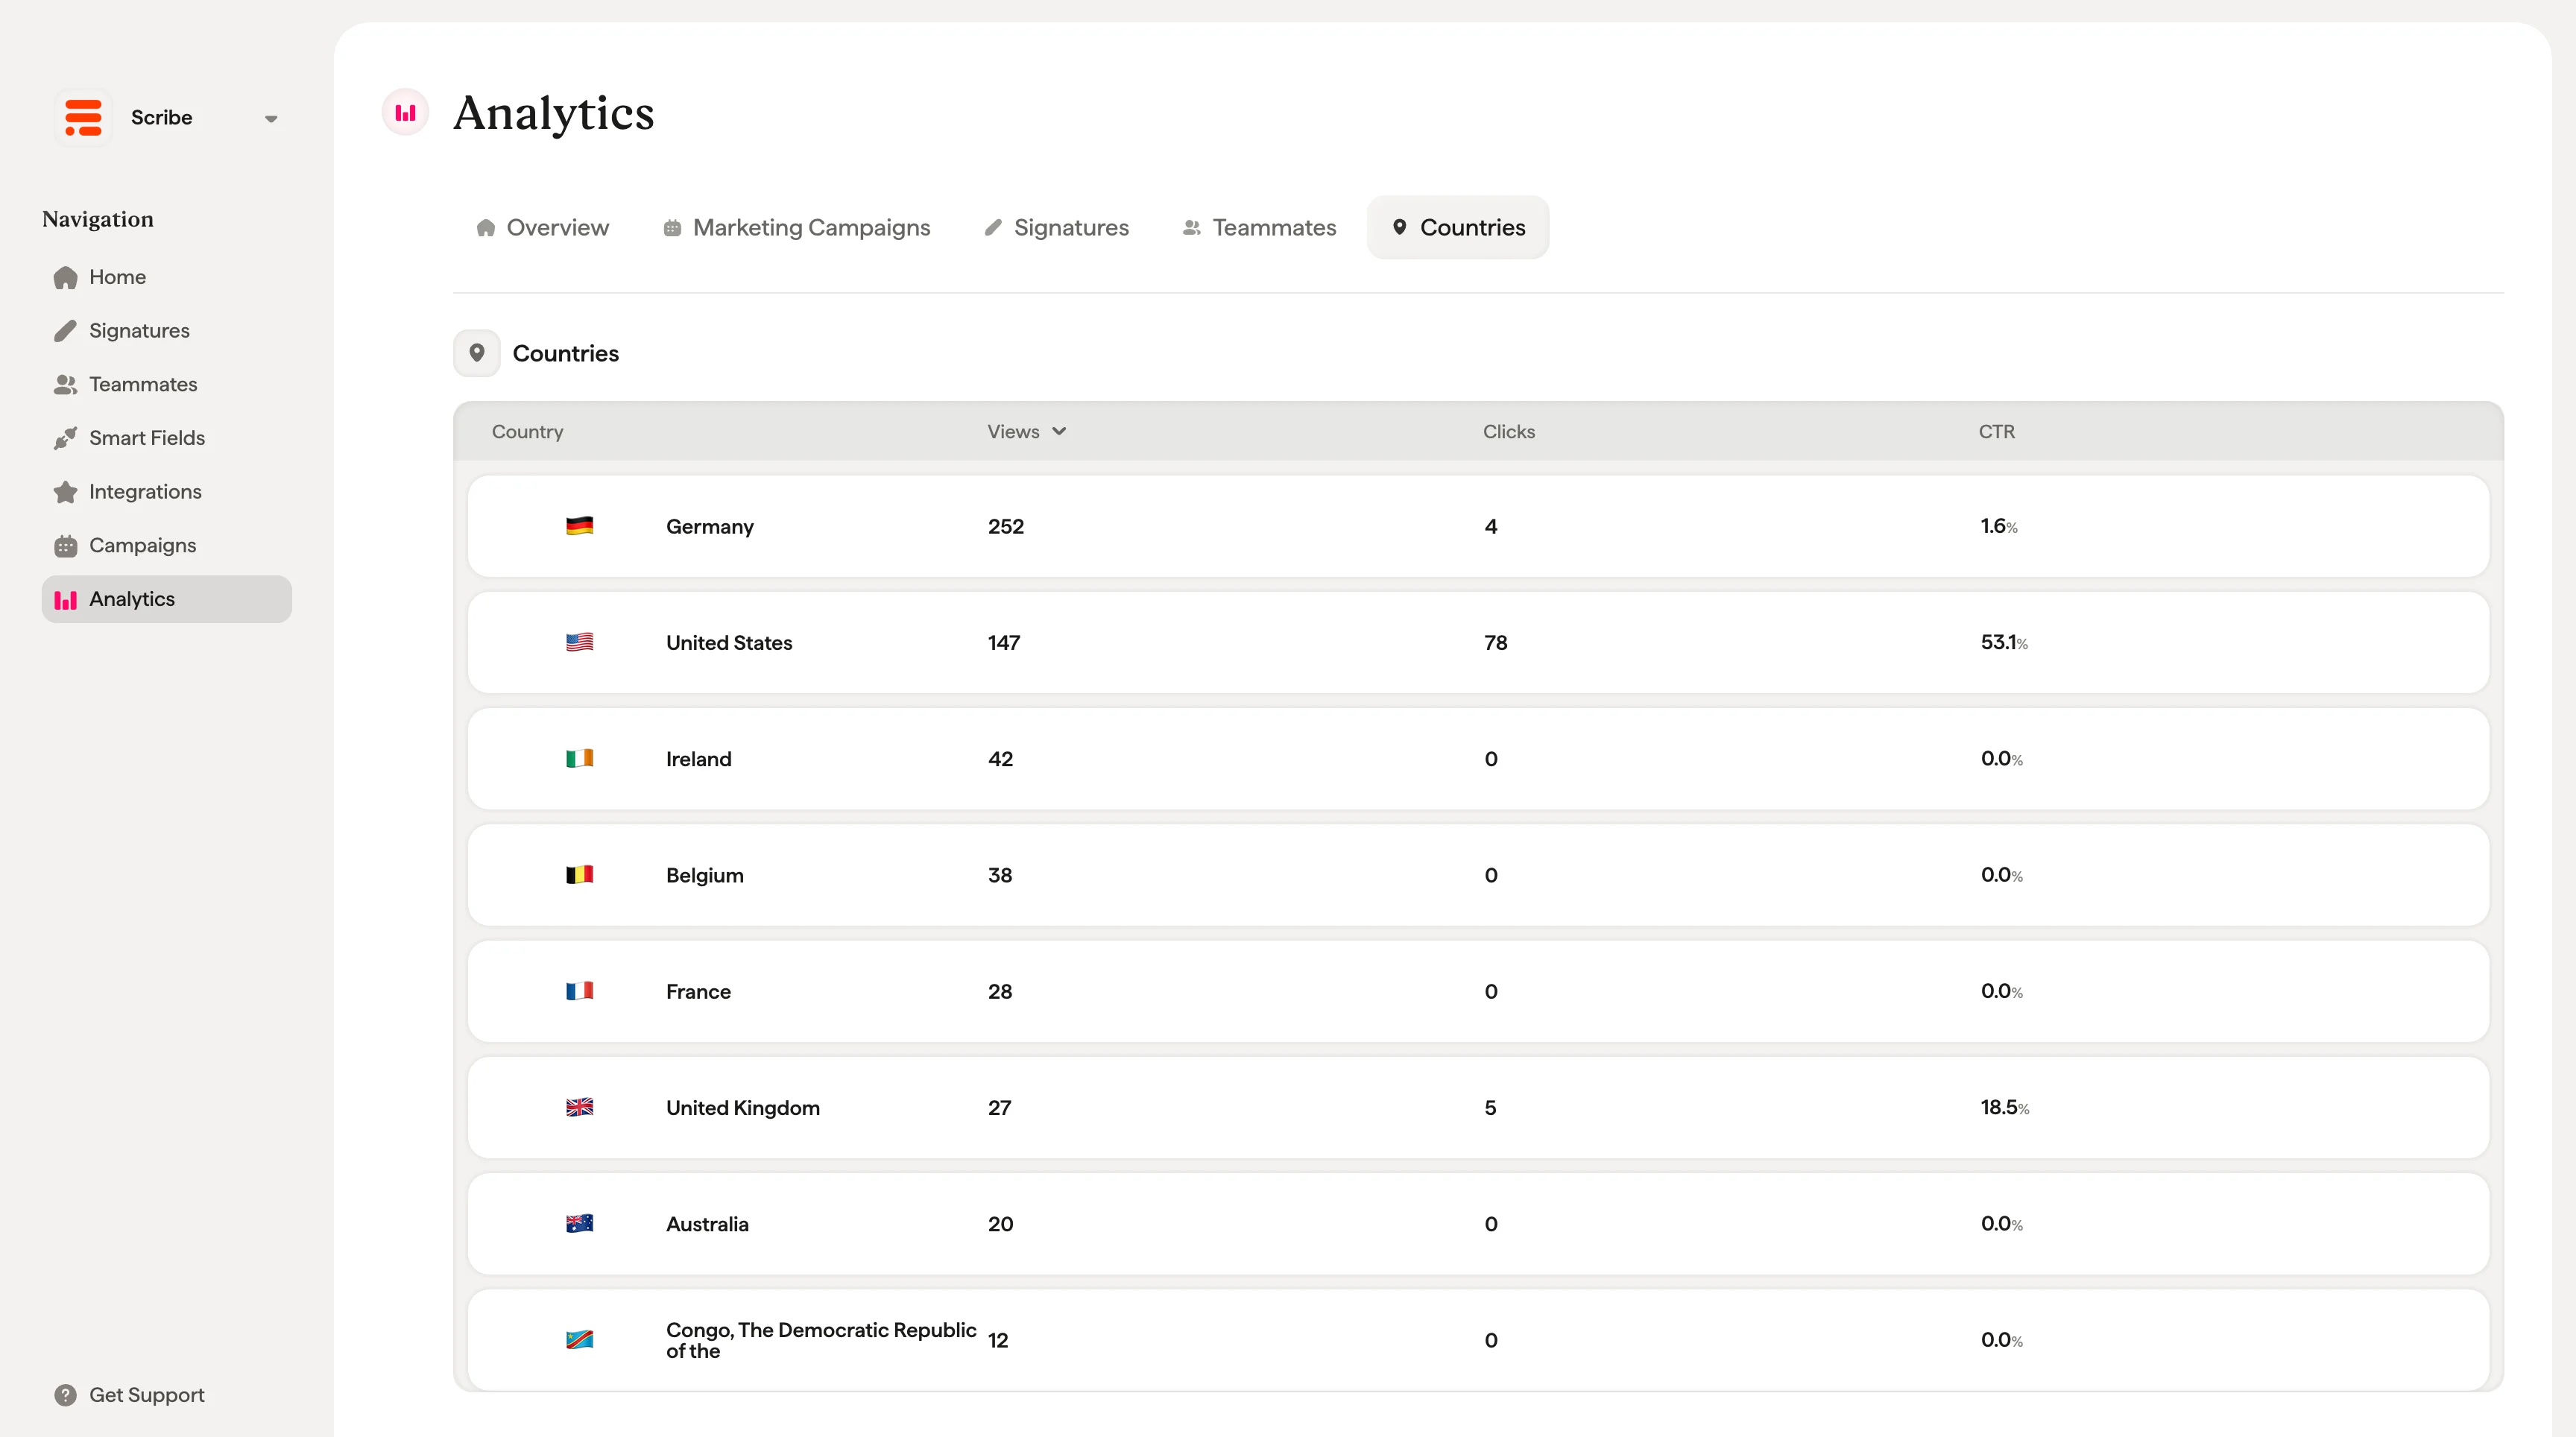
Countries tab
The Countries tab provides a geographic breakdown of signature engagement. Each row shows:
This helps you understand where your emails are making the most impact and tailor campaigns to specific regions.