Overview chart
The top section shows three key metrics over time:- Total Views: How many times the signature was seen by email recipients
- Total Clicks: How many times recipients clicked on an element in the signature
- Click-through Rate: The percentage of views that resulted in a click
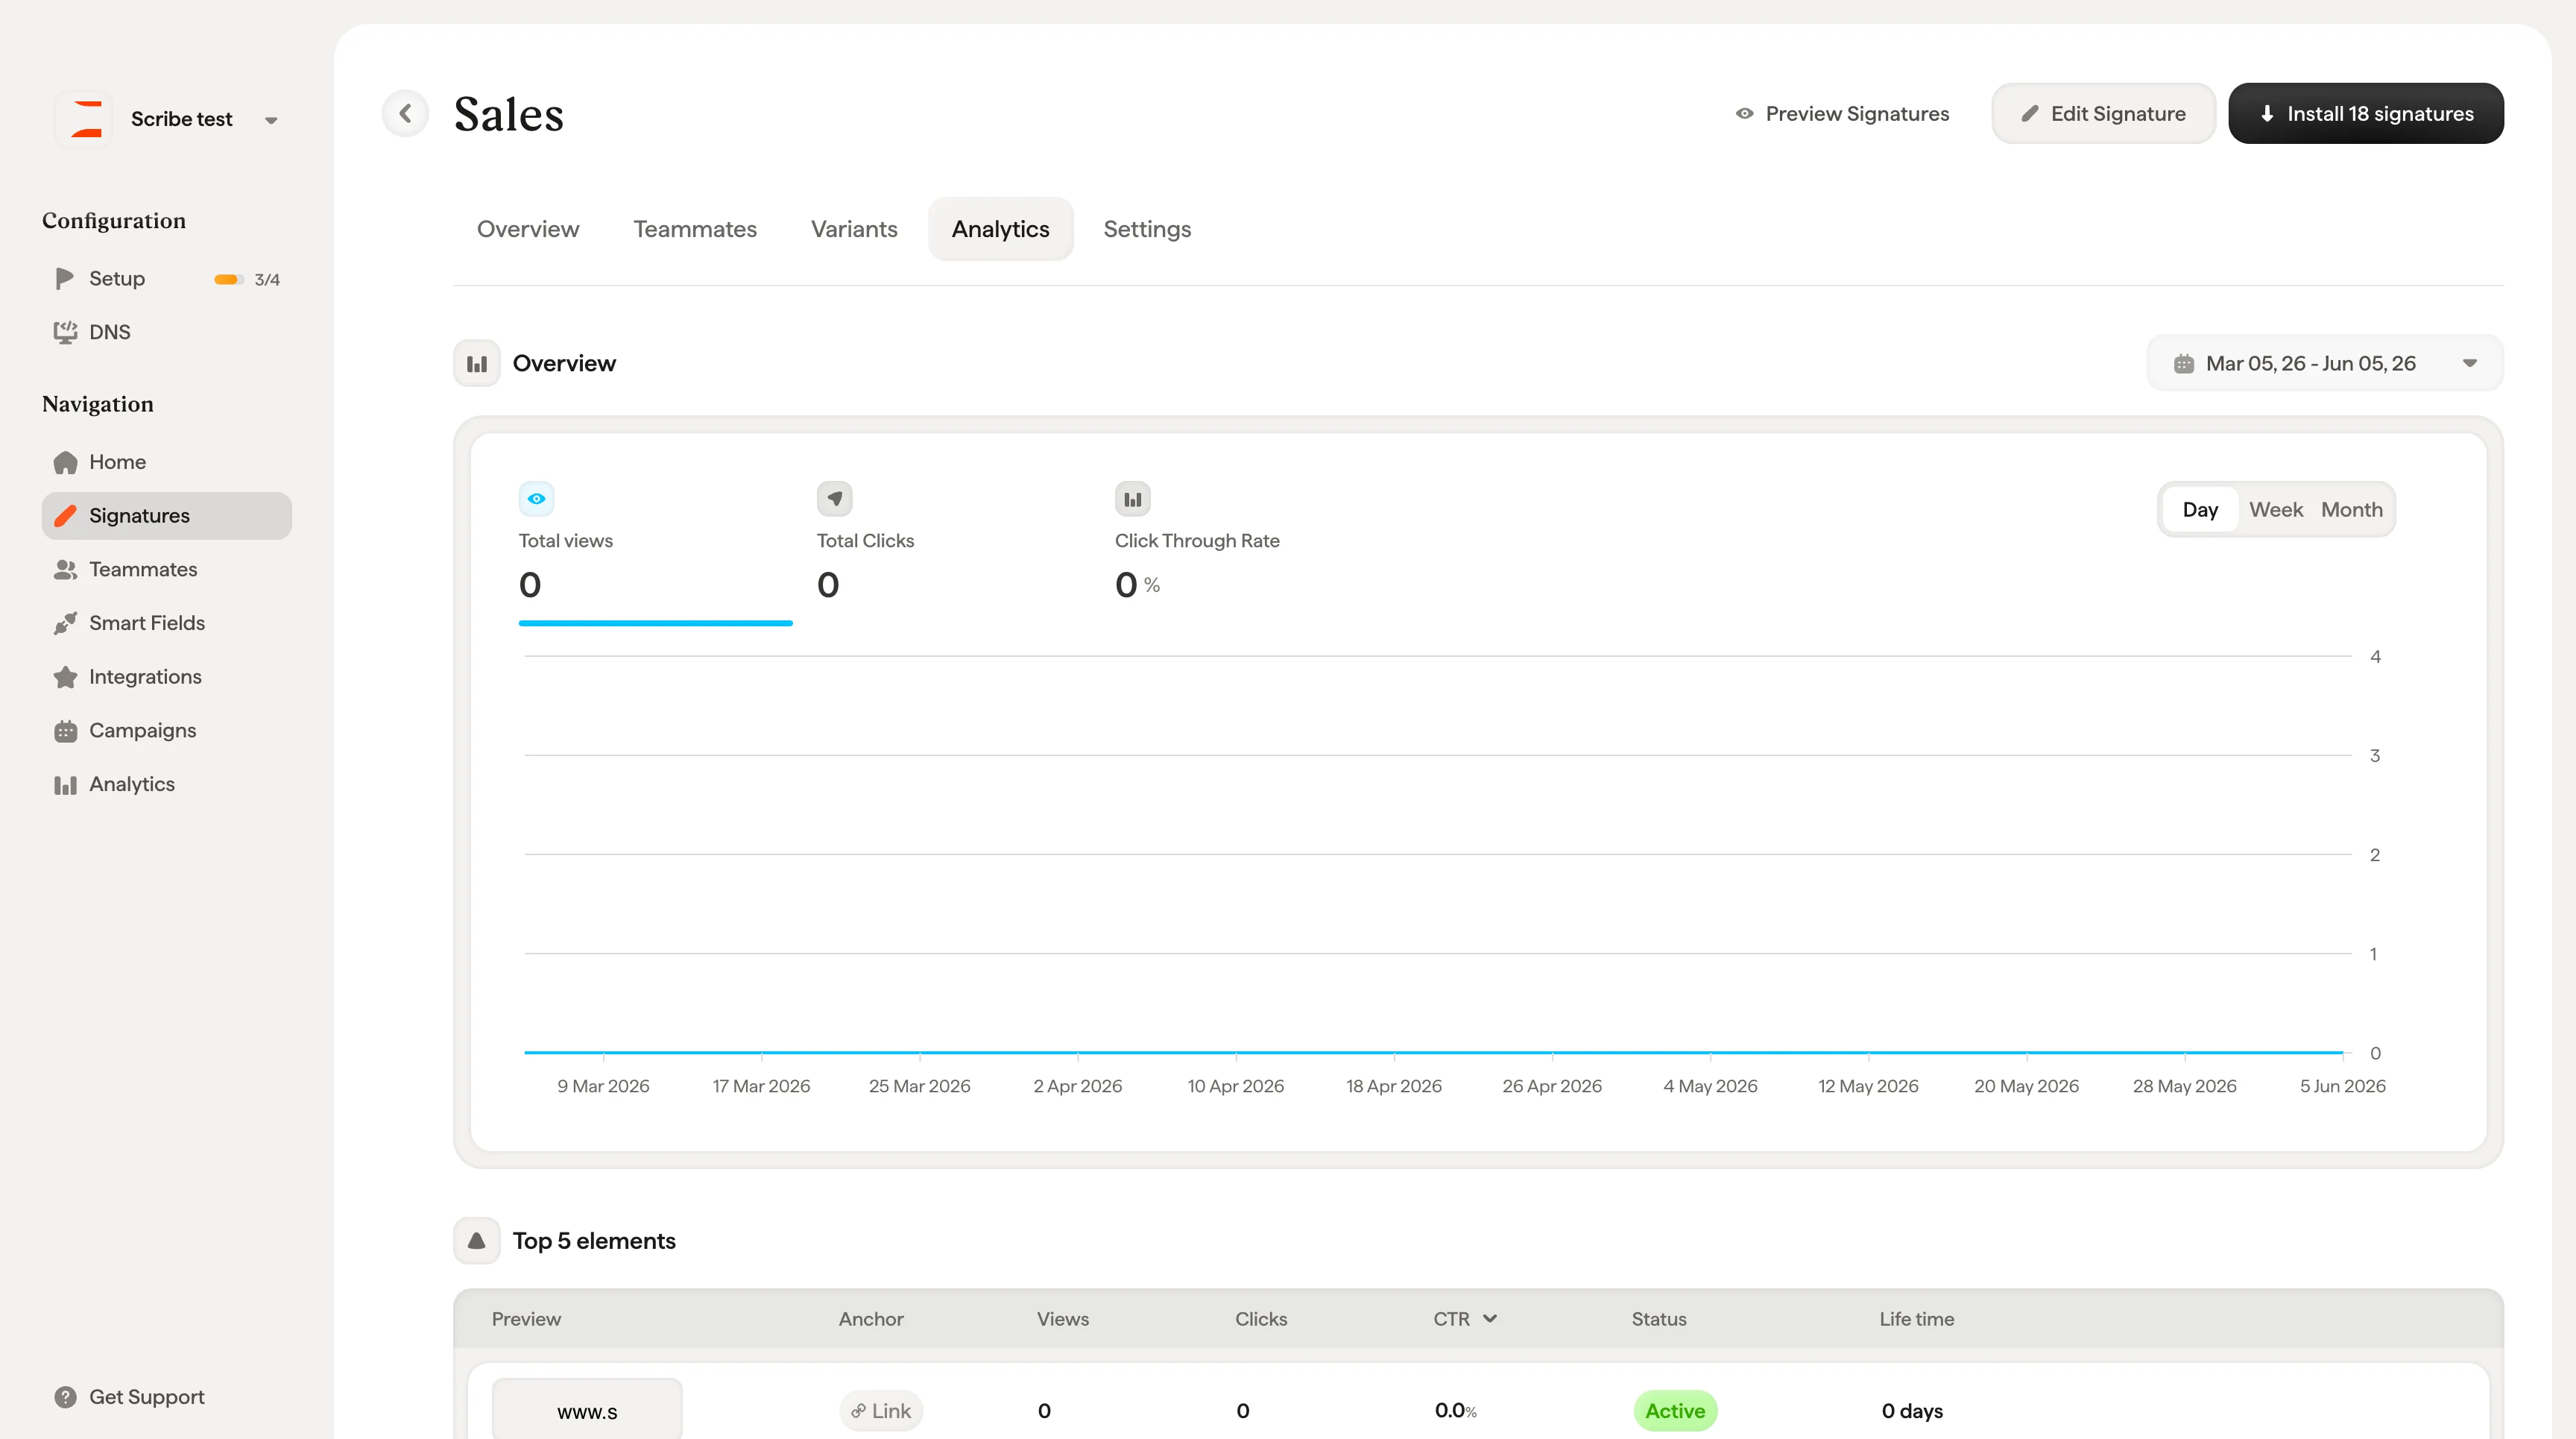
Top 5 elements
A table showing the five most-clicked elements in your signature. Each row shows the element’s preview, type (e.g., Social, Banner, Link), link, views, clicks, CTR, status, and lifetime.Top 5 teammates
Shows which teammates generate the most engagement. Each row displays the teammate’s name, email, total views, clicks, and CTR. This helps you identify your most active email senders and understand which teammates drive the most signature engagement.Top 5 countries
Shows where your email recipients are located based on signature views. Columns include country, views, clicks, and CTR.Analytics data requires tracking to be enabled. If you see “No data available yet”, make sure tracking is turned on in your workspace settings.